Document Type : Original Research Article
Authors
Department of Chemistry, Forman Christian College (A Chartered University), Lahore, Pakistan
Abstract
In the wake of growing concerns regarding the safety of our ecosystems, environmentally sustainable protocols for natural antioxidant extraction from plants are highly desirable. The current article is the outcome of the realization of this compelling need. Adiantum capillus-veneris L. is a widely found fern species known for its several ethnomedicinal uses. It is rich in phytochemicals such as phenolics of different types. In the current study, isopropanol-propylene glycol binary solvent was used as an extractant for bioactive compounds from this plant. The input factors used for optimization were time, temperature, solvent-to-solid ratio (SSR), selected responses were total phenolic content (TPC), total flavonoid content (TFC), and radical scavenging activity (RSA). The optimum conditions found by numerical optimization were SSR 30 mL/g, time 2.62 h, and temperature 60 °C with predicted TPC, TFC, and RSA as 16.14 mg gallic acid equivalents/g dry weight (DW), 57.64 mg rutin equivalents/g DW, and 94.63 %, respectively. The validation study strongly supported the suggested model with only a small % error. Based on these findings, a procedure may be developed for the safe and sustainable extraction of antioxidants from A. capillus-veneris for industrial application using isopropanol-propylene glycol binary solvent.
Graphical Abstract
)
Keywords
- Adiantum capillus
- veneris Isopropanol
- propylene glycol binary solvent Polyphenols and antioxidant activity Extraction optimization Response surface methodology
Main Subjects
Introduction
Adiantum capillus-veneris L. is a plant possessing several medicinal properties. It is generally termed maidenhair fern and is one of the Pteridaceae family’s species. The genus Adiantum comprises 200 species distributed globally [1]. A. capillus-veneris is widely prevalent around the world [2]. Although it is possible to harvest it during the summer and dry it for future use, the plant is most efficient when used fresh [3]. The plant has been found to show several therapeutic properties, such as antibacterial, anti-dermatitis, anti-inflammatory, analgesic, hypoglycemic, anti-proliferative, anticholesterolemic, neuroprotective, and antioxidant [4]. It is also used in conventional medicine for kidney stone dissolution [5]. capillus-veneris produces a wide range of phytochemicals, including flavonoids, steroids, terpenoids, and phenolic acids [6]. Its phenolics include chlorogenic acid, gallic acid, rutin, isoquercetin, kaempferol, kaempferol 3-sulfate, kaempferol 3-glucuronide, astragalin, quercetin 3-O-(6"- malonyl)-D-galactosidase [7]. Several triterpenoids have also been identified from the plant [8].
The choice of solvent is essential for the extraction of bioactive compounds from plants. With growing health and environmental safety concerns, the choice of solvent has become more important [9]. The isopropanol-propylene glycol binary solvent system has a high-rated extraction effectiveness and low toxicity, making it an attractive option to extract phenols and flavonoids using plants as a source [10]. Moreover, the isopropanol-propylene glycol binary solvent system has a moderate to high polarity depending on the ratios in which the components are combined, which makes it compatible with the extraction of flavonoids [11]. Isopropanol (isopropyl alcohol (IPA), 2-propanol) is a clear liquid and has a fruity scent with a slightly bitter flavor. It is found in several commercial goods such as antifreeze, disinfectants, cleaning agents, skin and hair cosmetics, and hand sanitizers [12].
Isopropanol can either receive or generate hydrogen bonds [13]. Isopropanol is an effective extraction solvent. It provides a safer environment to work for the extraction of plant bioactives [14]. It is less flammable and low in toxicity giving it an advantage over several other organic solvents [15]. After ethanol, isopropanol is the alcohol that is commonly used. About 15,000 to 21,000 cases of isopropanol exposure per year have been reported to US poison control centers. In 2013, there were 15,454 single substance exposures, 85% of which were accidental, 4% of which had mild to serious consequences, and three of which resulted in fatalities, showing a low case-fatality rate [12]. Propylene glycol is also a clear, odorless, and tasteless liquid. Because of its ability to retain moisture, it is utilized in the food as well as cosmetic sectors. Due to its lack of flammability, toxicity, and hazards, it may be used in place of ethanol in circumstances where it is not approved [16].
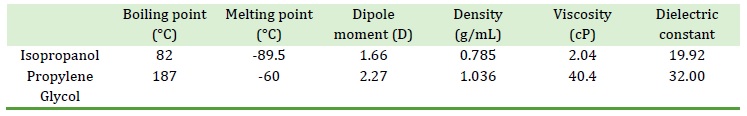
Propylene glycol (PG) is regarded by the Food and Drug Administration (FDA), USA, to be Generally Recognized As Safe (GRAS) [17]. PG levels in aqueous systems of up to 40 % are safe to be consumed by humans [18]. PG, however, is viscous and, thus, may not be a viable extractant of bioactive compounds from plants. This difficulty can be overcome using it in combination with a suitable other solvent. Based on their physical characteristics, such as dielectric constant, dipole moment, viscosity, and boiling point, a binary solvent system consisting of IPA and PG is expected to be an efficient extractant for polyphenols and other antioxidant compounds (Table 1).
Using an extraction method on an industrial scale, process optimization is important. The response surface methodology (RSM) is a commonly used optimization method. It is a set of statistical and mathematical methods [19, 20]. The use of RSM can reduce the number of experiments necessary to optimize the extraction process, making it a cost-effective and time-efficient approach [21]. Two basic types of designs are used in RSM: the Box-Behnken Design (BBD) and the Central Composite Design (CCD). The BBD is regarded as relatively simpler because it requires less time, resources, and labor. In the research conducted, the Box-Behnken Design has been employed to investigate ideal parameters for isopropanol-propylene glycol-based antioxidant component extraction from A. capillus-veneris.
Previously, flavonoid and phenolic contents and antioxidant activity of A. capillus-veneris have been studied using different solvents as extractants [22-25]. However, the literature shows no study on this plant using IPA or PG alone or in combination as an extraction medium for its bioactive compounds. Thus, the use of IPA-PG binary solvent system and RSM-based extraction optimization are being reported here for the first time. Thus, the primary motive of this study was to evaluate the effectiveness of isopropanol-propylene glycol binary solvent as an extractant for phenolics and other antioxidant compounds from A. capillus-veneris and extraction optimization as per response surface methodology (RSM). The purpose was to provide the industry with a bioactive compounds recovery process that is not only efficient and cost-effective, but also safe and green.
Experimental
Chemicals
The chemicals used in this study were acquired from various companies. Sodium nitrite, rutin, and Folin-Ciocalteu reagent were bought from Merck (Darmstadt, Germany), gallic acid was purchased from Riedel-de-Haen (Seelze, Germany), DPPH (2,2-diphenyl-1-picrylhydrazyl), and ascorbic acid were acquired from MP Biomedicals (Illkirch, France).
Table 1. Some relevant physical properties of isopropanol and propylene glycol
Plant collection and preparation
capillus-veneris used in our research was collected from Mansehra, Hazara (Pakistan) in June 2021. It was kindly provided to us by Dr. Nighat Sultana and identified by the taxonomist of Hazara University, Mansehra, Pakistan (voucher number 15697). The plant was washed properly, and then air-dried at the laboratory temperature (25 °C). After crushing the plant by hand, it was ground using a grinder. That ground material was passed through an 80-mesh sieve. The powdered form of the plant sample was put in a polythene bag and kept in a freezer.
Extraction procedure
For the optimization study, 17 conical flasks (250 mL) were prepared and labeled according to run orders, and 1 g plant powder was added to each flask. Isopropanol-propylene glycol (50:50) mix was added in all conical flasks to give different solvent-to-solid ratios (10 mL/g, 20 mL/g, and 30 mL/g) according to BBD. The flasks were then closed with aluminum foil to prevent the solvent from evaporating. The flasks were kept on shaking in a shaking incubator at temperatures 20 °C, 40 °C, and 60 °C and time spans 1 h, 2 h, and 3 h, according to experimental design. The RPM of the shaking incubator was set at 200. After all the samples were shaken according to the BBD, they were shifted to the labeled centrifuge tubes, and centrifuged for 1 minute. Then, the samples were filtered with the help of Whatman filter paper 42. All 17 samples were processed in this way and the filtrates were collected in glass vials after filtration. These filtrates were used for TPC, TFC, and DPPH assays.
Assay for total phenolic content (TPC)
The colorimetric protocol developed by Singleton and Rossi (1965) was applied to evaluate the total phenolic content of A. capillus-veneris IPA-PG extracts according to a previously reported procedure [26]. Briefly, all tubes were carefully covered using aluminum foil from the sides and labeled according to the design. A measured volume of 40 µL plant sample (17 samples prepared according to RSM) was poured into each test tube. Gallic acid dilutions were employed instead of plant samples for the standard curve. Afterward, 3.16 mL distilled water was added into each test tube, followed by adding 200 µL Folin-Ciocalteu reagent in the dark. After incubating the samples for 8 min, 600 µL 20% sodium carbonate solution was put into each test tube. Blank was prepared by taking isopropanol-propylene glycol (solvent) in place of plant extract. Following that, each sample was incubated at 40 °C for thirty minutes. Once incubation was done, the absorbance of all samples was noted on a UV-visible spectrophotometer at 765 nm. Using the formula, y = 0.0012x - 0.0216, where x is the amount of gallic acid equivalents (μg/mL) and y is the absorbance at 765 nm, the total phenolic content was calculated as μg of gallic acid equivalents (GAE) per gram of the dried plant powder.
Assay for total flavonoid content (TFC)
For evaluating the total flavonoid content in the IPA-PG extracts of A. capillus-veneris, a reported procedure was used [26]. Briefly, all 17 test tubes were covered carefully with aluminum foil and labeled, and a 300 µL plant sample was added to each test tube. For the standard curve, rutin dilutions were used in the place of the plant sample. A measured volume of aqueous methanol (3.4 mL) and 150 µL 0.5M solution of NaNO2 were then placed in test tubes. After 5 minutes, 150 µL 0.3 M solution of AlCl3 was added. After a 5-minute incubation, 1 mL solution of NaOH (1 M) was placed in the test tubes. The distilled water was added in place of AlCl3 and isopropanol-propylene glycol (solvent) in place of plant extract for the blank preparation. Absorbance was noted via a UV-visible spectrophotometer at 506 nm. Using the formula, y = 0.0004x + 0.0011, where x is the amount of rutin equivalents (μg/mL) and y is the absorbance at 506 nm, the total flavonoid content of each extract was calculated as μg of rutin equivalents (RE) per gram of the dried plant powder.
Assay for DPPH radical scavenging activity (RSA)
Radical scavenging activity of the IPA-PG extracts of the fern A. capillus-veneris L. was estimated according to the DPPH assay using a reported procedure [26]. Briefly, a measured volume of 3 mL DPPH working solution in methanol and 1 mL plant extract (17 samples were prepared according to RSM) was taken in each test tube. Blank was prepared by adding 3 mL isopropanol-propylene glycol (solvent) in 1 mL plant extract. To prepare the control, 3 mL working solution was added in 1 mL isopropanol-propylene glycol (solvent), and then the absorbance of all samples was measured on a UV-Visible spectrophotometer at 517 nm, and % radical scavenging or antioxidant activity was calculated.
Statistical analysis
For optimization, the Box-Behnken design (BBD) of RSM was applied. Modeling and statistical analysis were done using the software Design Expert (Stat-Ease, Inc., Minneapolis, MN, US). The design consisted of 17 runs with 5 central points. For better reproducibility, experiments were conducted three times and means were calculated with standard deviations.
Results and Discussion
The extraction of bioactive compounds from Adiantum capillus-veneris L. was done in an isopropanol-propylene glycol binary solvent according to the Box-Behnken design of RSM and the results are shown in Table 2. As Error! Not a valid bookmark self-reference. shows, the highest TPC value was 14.90 ± 0.19 mg GAE/g DW, which was obtained at standard order 8 (SSR 30, time 2 h, temperature 60 °C). The highest DPPH radical scavenging activity also occurred at standard order 8, which was 95.65 ± 0.19 %. However, the highest TFC occurred at standard order 12 (SSR 20 mg/L, time 3 h, temperature 60 °C), which was 57.64 ± 0.21 mg RE/g DW. Both orders have the same temperature, which was 60 °C. The data shows that TPC and RSA required higher SSR and lower extraction time than TFC. There is a strong correlation between TPC and RSA. Since TPC is a measure of the overall polyphenolic content that also includes TFC, these compounds appear to have a major contribution to the RSA of the plant under study.
Table 2. Experimental design for extraction optimization of bioactive molecules from Adiantum capillus-veneris L. and experimental results
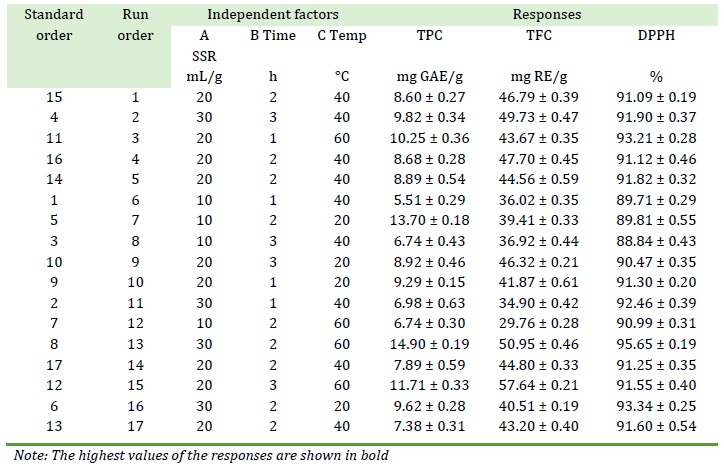
Table 3: Model fit summary of TPC, TFC, and RSA
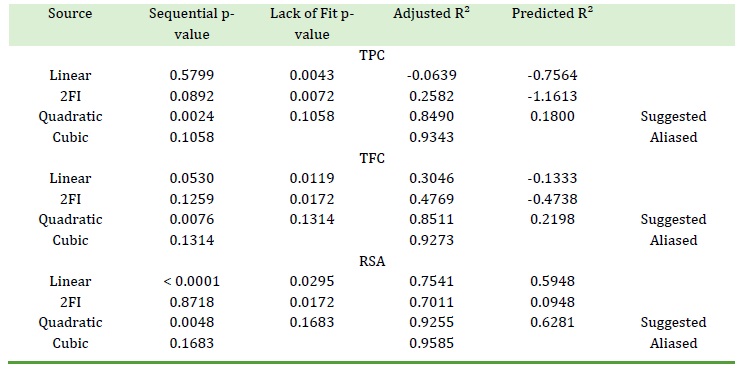
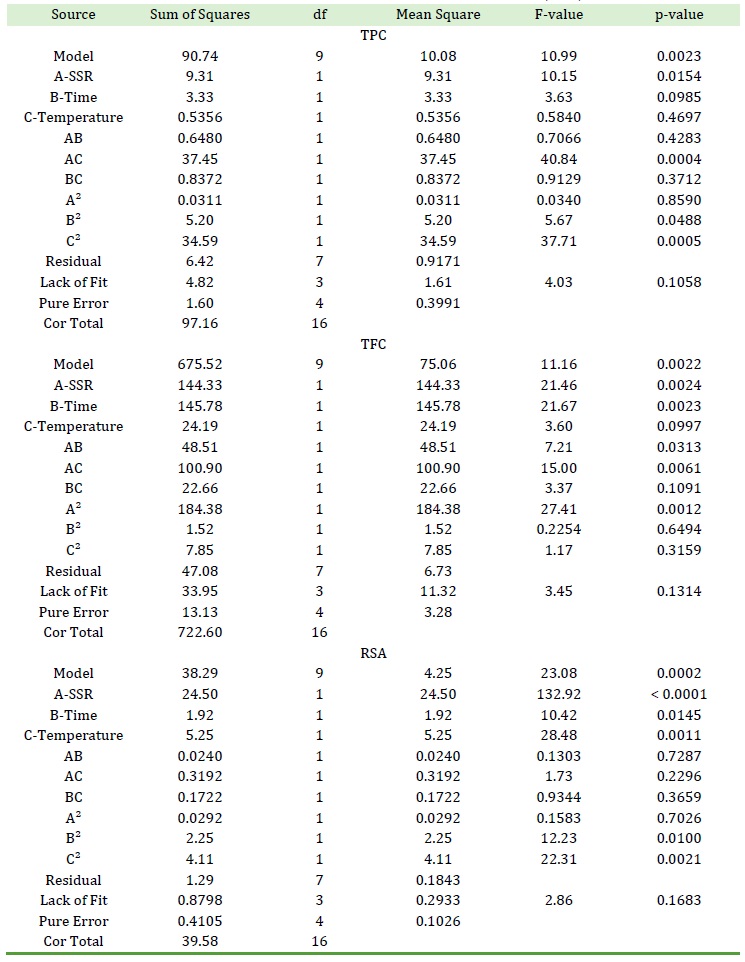
Table 4. ANOVA details for the suggested quadratic models for TPC, TFC, and RSA
Model fitting
The data (Table 2) were put in a second-degree polynomial equation using the optimization software and the equation was solved for each response. This model-fitting operation suggested quadratic models for TPC, TFC, and RSA (Table 3). As Table 3 shows, quadratic models were suggested based on the significant sequential p-values of the suggested models and their non-significant lack of fit p-values. A model or term was considered significant if its p-value was less than 0.050. These models were subjected to ANOVA and the results are shown in Table 4.
The details of the fit statistics of the responses are displayed in Table 5.
Regression equations
For TPC, TFC, and RSA, regression equations based only on the significant terms are presented in
3D Surface plots
3D surface plots of TPC, TFC, and RSA are displayed in Figures 1, 2 and 3. The experimental responses were significantly impacted by the solid-to-solvent ratio (see Figure 1).
The diffusion rate decreased as SSR was increased because the concentration gradient was reduced [27]. The TPC dropped as SSR increased from 10 mL/g to 30 mL/g at room temperature, but it increased at higher temperatures. The optimal SSR was 20 mL/g based on these observations. TPC increased with time up to 2.5 h, but then started to decrease. Prolonged exposure time to heating resulted in an overall increase in TPC. Since bioactive molecules are thermo-liable, this behavior is frequently linked to the adverse effects that cause the breakdown of extracted chemicals [28]. With the rise in temperature and increase in time, TFC increased relatively (see Figure 2).
Table 5. Fit statistics of TPC, TFC, and RSA
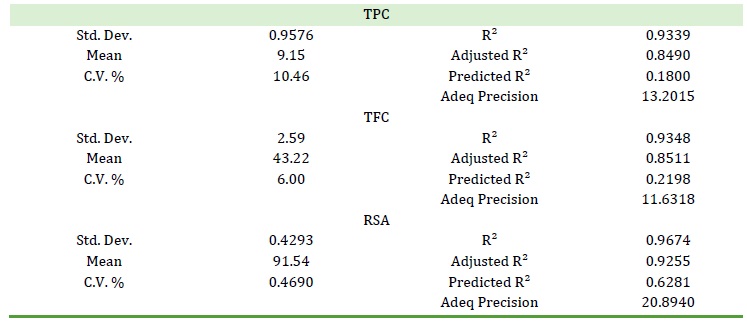
Table 6. Regression equations based on significant terms only
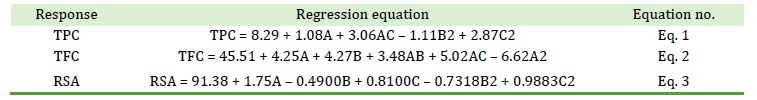
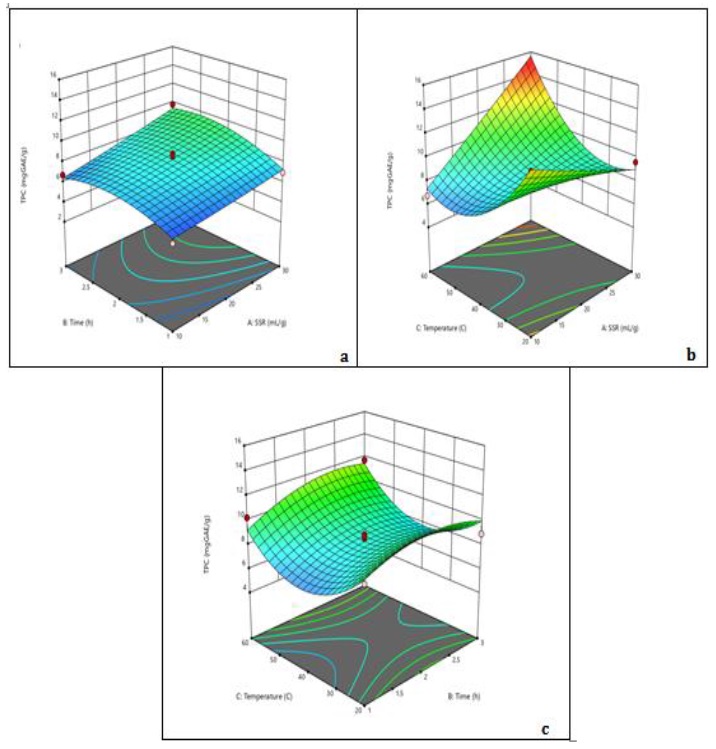
Figure 1. 3D surface plots of TPC showing (a) the interaction of time and SSR where temperature (40 °C) is constant, (b) the interaction of SSR and temperature where time (2 h) is constant, and (c) the interaction of time and temperature where SSR (20 mL/g) is constant
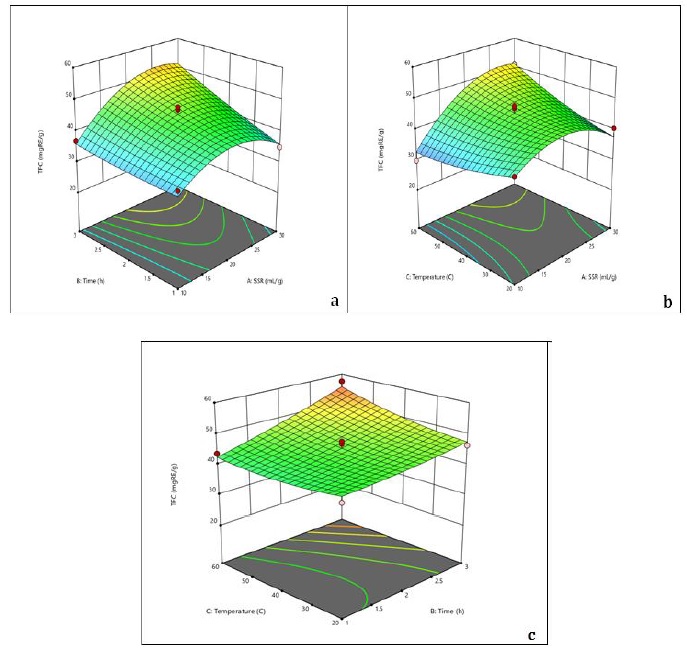
Figure 2. 3D surface plots of TFC showing (a) the interaction of time and SSR where temperature (40 °C) is constant, (b) the interaction of SSR and temperature where time (2 h) is constant, and (c) the interaction of time and temperature where SSR (20 mL/g) is constant
The interactive effect of time and SSR produced an overall increase in TFC. The increment in the area of contact between solute and solvent that favors extraction may be the cause of this behavior [29, 30]. The solute diffusivity improves. Moreover, the extraction yield rises with higher solvent ratios. If the ratio, however, is higher than the optimum value, the excess solvent has no impact on the extraction yield [31]. Therefore, 20 mL/g can be taken as an ideal SSR. At the optimum condition of time 2.5 h, the antioxidant activity increased, but then started decreasing after the optimal condition (see Figure 3).
With the increase in SSR, the antioxidant activity was maximum because of the increased solubility of these compounds in a higher volume of solvent. By increasing the temperature, the antioxidant activity started to rise which may be due to the increased extraction efficiency of antioxidant compounds at higher temperatures [32].
Numerical optimization and validation study
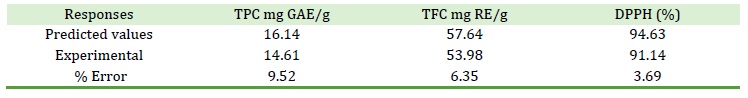
Numerical optimization was done in accordance with the desirability function procedure [26]. The constraints kept in numerical optimization were as follows: the input factors were kept at ‘in range’ and responses were kept at ‘maximize’ options and the importance of each term was 3. The software gave 41 solutions, out of which one was shown as selected with a desirability of 0.947. The optimum conditions were SSR 30 mL/g, time 2.62 h, and temperature 60 °C. Under these conditions, validation experiments were carried out and the results are shown in Table 7.
The validation experiments were performed in triplicate and the mean was calculated. Based on predicted and experimental values of responses, relative % errors ([predicted - experimental)/ predicted] × 100) were calculated. The findings of the experiment came out close to those predicted by models and the % errors were very small (3.69-9.52%). Thus, the validation experiments strongly support the predicted model. The model can, thus, be utilized on a large scale with confidence.
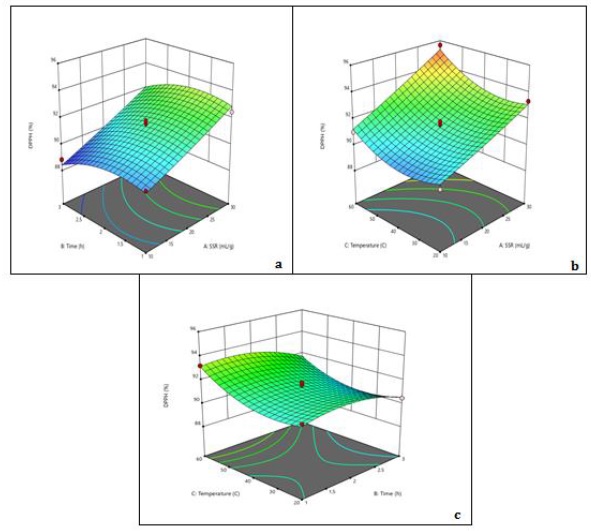
Figure 3. 3D surface plots of RSA showing (a) the interaction of time and SSR where temperature (40 °C) is constant, (b) the interaction of SSR and temperature where time (2 h) is constant, and (c) the interaction of time and temperature where SSR (20 mL/g) is constant
Table 7. Comparison of predicted and experimental response values and % errors
The highest TPC was observed at 30 mL/g SSR, 60 ᵒC temperature, and time 2 hours. The positive correlation observed with all three factors indicates these factors are fundamental in determining TPC value. In comparison to solvent concentration influence, the temperature’s impact is less significant. The positive effects of temperature could be attributed to increased diffusion, which would result in the breakdown of the raw material's compact cell wall structure, and greater solubility and solvent penetration. TPC increased sharply in response to small variations in solvent concentration, which was explicable by the solvent's higher selectivity for moderately polar polyphenols [33]. The regression equation for TPC showed positive results for all three factors, which indicates that an increase in time, temperature along with solvent to solid ratio can significantly impact TPC value of A. capillus-veneris. The 3D graphs also support this observation, as an increase in temperature and solvent-to-solid ratio led to a rise in TPC value. However, the time factor did not show a significant impact on the TPC value. To achieve the maximum yield of the target chemicals without having them degrade, temperature optimization may be beneficial [34]. These observations are crucial as they can help optimize the extraction process of A. capillus-veneris to obtain a higher TPC value.
The highest TFC value was observed at 20 mL/g SSR, 60 C temperature, and time 3 hours, with a value of 57.64 mg RE/g. The regression equation for TFC showed a positive correlation with all three factors. However, the 3D plot illustrated that the TFC value decreased with solvent to solid ratio, while increasing with time as well as temperature. The findings suggest that the optimal conditions for obtaining a high TFC value of A. capillus-veneris were 60 ºC temperature for 3 hours and a moderate solvent-to-solid ratio of 20 mL/g. The increase in temperature and time may have led to the release of flavonoids from the plant material, resulting in higher TFC value. On the other hand, the decrease in solvent-to-solid ratio might have reduced the efficiency of extraction, resulting in a lower TFC value [35].
The highest DPPH activity observed was 95.65 %, which suggests that the extract of the plant can scavenge a high percentage of free radicals. The regression analysis also showed a positive correlation with the temperature as well as the solvent-to-solid ratio, while the time factor showed a negative correlation. This suggests that the extraction efficacy of plant's antioxidant compounds can be enhanced by increasing temperature and solvent-to-solid ratio while limiting time extraction. The extraction yield also increases with temperature due to the accelerated diffusion of solvent and analytes’ improved solubility in the solvent of extraction caused by altered viscosity as well as density [36].
The 3D plots further support these findings, as they show that higher temperatures and solvent-to-solid ratios are associated with increased DPPH activity. These findings are in accordance with prior research on A. capillus-veneris which has also reported high antioxidant activity. The positive correlation between DPPH activity and temperature may be due to the increased extraction efficiency of antioxidant compounds at higher temperatures, while the positive correlation with solvent-to-solid ratio may be because these compounds are more soluble in a higher volume of solvent [32].
Overall, these findings suggest that A. capillus-veneris has strong antioxidant potential and that its antioxidant activity can be enhanced by optimizing the extracting conditions, particularly solvent-to-solid ratio, and temperature. These results have important implications for the potential application of A. capillus-veneris as a natural antioxidant in food, pharmaceuticals, and cosmetic products.
Conclusion
As the results demonstrate, the binary solvent consisting of isopropanol and propylene glycol proved to be an efficient extraction medium for antioxidant compounds, flavonoids, and phenolics in general from the fern Adiantum capillus-veneris. Extraction optimization discovered the optimum conditions which were a solvent-to-solid ratio (SSR) of 30 mL/g, extraction time of 2.62 h, and extraction temperature of 60 °C. Under these conditions, the predicted responses TPC, TFC, and antioxidant activity were 16.14 mg GAE/g DW, 57.64 mg RE/g DW, and 94.63 %, respectively, which were strongly supported by the validation study. The results of the study offer valuable insights that can provide a foundation for the development of an industrial-scale process for the recovery of antioxidant compounds from A. capillus-veneris.
Disclosure Statement
No potential conflict of interest was reported by the authors.
Funding
This research did not receive any specific grant from funding agencies in the public, commercial, or not-for-profit sectors.
Authors' Contributions
All authors contributed to data analysis, drafting, and revising of the paper and agreed to be responsible for all the aspects of this work.
Orcid
Dildar Ahmed
https://orcid.org/0000-0002-3518-7181
How to cite this manuscript: Dildar Ahmed, Aneeqa Mahmood. Green Extraction of Antioxidant Compounds from Adiantum capillus-veneris L. and Optimization According to Response Surface Methodology. Asian Journal of Green Chemistry, 8(2) 2024, 173-187. DOI: 10.48309/ajgc.2024.421849.1455
)