Document Type : Original Research Article
Author
Department of Chemistry, Technical and Vocational University (TVU), Tehran, Iran
Abstract
The zinc oxide nanoparticles (ZnO NPs) were produced by employing Echinophora platyloba DC extract (E. platyloba). The extract of E. platyloba is believed to act as a non-toxic source of stabilizing and reducing agent. The generation of the ZnO NPs was characterized by SEM-EDX, zeta potential, DLS, TEM, ultraviolet-visible, and FT-IR analysis. The green synthesized ZnO NPs are quasi-spherical in shape, some of which show facets and irregular shapes with different sizes from 27.18 to 54.24 nm. The corresponding average zeta potential value is -28.9 mV, which supports the high stability of ZnO NPs. The ZnO NPs interaction with human serum albumin (HSA) has been explored by employing absorption and fluorescence titration methods. Our finding revealed that the ZnO NPs quenched the HSA fluorescence via stat quenching mode. Assessment of the fluorescence quenching data indicated moderate binding affinity (Kb =2.10× 10³ M−1 at 298.15 K) between ZnO NPs and HSA. In silico molecular docking studies further corroborated well with the experimental results.
Graphical Abstract
)
Keywords
Main Subjects
Introduction
Nanotechnology, as one of the most important scientific fields, has a profound impact on the global economy and society, and its significance cannot be overstated [1, 2]. In fact, nanoparticles are currently used in various areas of research and technology [3]. Therefore, it is essential to develop techniques and methods for synthesizing and characterizing nanoparticles, as these materials have broad applications [4]. In recent times, there has been a development of innovative and eco-friendly methods for synthesizing nanoparticles under the concept of "Green nanotechnology."
These approaches involve examining the physical, chemical, and biological properties (including natural precursors) to design and create nanoparticles that possess the desired functionalities, size, and shape [5-8]. Compared to the conventional synthesis techniques, the utilization of microorganisms (like fungi and bacteria) and natural products (like plant extracts, fruit juice, and polysaccharides) containing a large number of hydrogen atoms for nanoparticle production has more benefits, including biocompatibility, lower production costs, and natural reductive chemical environments [9, 10]. These approaches do not require toxic solvents, chemical precursors, or additional reducing agents [11, 12]. Recent research has demonstrated the significance of green synthesis methods in the production of metal oxide nanoparticles, including Zn, Ag, Cu, Au, Ni, and others [13-16]. ZnO NPs have gained considerable attention compared to the other metal oxides due to their ample availability, steadiness, electrical conductivity, and ability to generate an electric charge when subjected to pressure, safety, and optical clarity [17, 18].
They have been applied in numerous domains such as coatings, coverings, polymers, gas detectors, photovoltaic devices, medicines, laser technology, and devices based on optics and electronics [19, 20]. For a considerable period, ZnO NPs have been further used extensively in cosmetics and sunscreens as safeguarding agents. In addition, the antimicrobial and antifungal features of ZnO NPs have been extensively proven [21-23]. The present study details the production of ZnO NPs via the utilization of extract from Echinophora platyloba DC., a native plant of Iran that is commonly known as "Khusharizeh" and is utilized as both a seasoning and a vegetable. Previous research has demonstrated the potential antitumor properties of E. platyloba, and numerous publications have explored its diverse biological activities and chemical components. Among its primary constituents are trans-β-ocimene (67.9%), 2-furanone (6.2%), myrcene (6.0%), linalool (3.1%), and cis-β- ocimene (2.3%) [24]. Out of the various proteins present in blood plasma, serum albumin is the most plentiful and is commonly employed as a prototype protein for investigating drug interactions. As a major transport protein in human blood plasma, HSA performs a crucial role in ferrying endogenous and exogenous ligands, including drugs and metabolites. The degree of binding between a drug and HSA is a determining factor for its delivery, distribution, efficacy, and toxicity within a living organism [25, 26].
The interaction between ZnO NPs and the active sites of proteins can potentially alter the function of the protein, leading to toxic effects [27]. Therefore, understanding the impact of ZnO NPs on HSA is of paramount importance in both biomedical applications and in addressing bio-safety concerns [28].
The primary objective of this study is to synthesize ZnO NPs using a green, convenient, economical, and eco-friendly method, and also to characterize their interaction with HSA under simulative physiological conditions (pH=7.40) using both molecular docking and spectroscopic techniques. Such a research is necessary to gain insight into the molecular mechanism underlying the interactions of ZnO NPs with HSA. Understanding the nature of interactions (e.g., interaction forces, binding sites, and affinity) and their implications (e.g., conformation and activity of interacting proteins, as well as the stability and functionality of the NPs) is essential to improve the design and handle nanomaterials in a physiological environment. In similar work, Shahabadi et al. [29] reported the HSA, HHb, and Lys interaction of green hexagonal silver nanoparticles produced by wood extract of wild cherry shrub. Furthermore, Sajid Ali et al. [30] showed the interaction of green synthesized silver nanoparticles obtained from Solanum tuberosum extract with HSA.
Experimental
Materials and Methods
An Agilent 8453 spectrophotometer was utilized to perform the UV-Vis spectroscopic measurement of HSA-complex systems. A JASCO FP 6200 spectrofluorometer was employed to measure the emission spectra. A Metrohm model of 827 pH meters was applied to evaluate the pH values.
Synthesis of ZnO
For green synthesis of ZnO NPs, zinc nitrate, and interaction investigations, NaH2PO4, Na2HPO4, and HSA were provided from Sigma Aldrich and Merck Millipore. NaH2PO4 and Na2HPO4 were dissolved in distilled water to prepare a phosphate buffer solution (100 mM, pH= 7.4). The stock solution of protein was prepared by dissolving its powder in the phosphate buffer solution. ZnO NPs solution (1 mg/ml) was sonicated for 10 min to perform the experiments (Figure 1a).
The aqueous extract of echinophora platyloba DC. preparation
The E. platyloba plant was harvested from the surroundings of Gilan-e Gharb mountain of Kermanshah Province, Iran (Figure 1b). E. platyloba was dried and then grinded. After grinding, 10 g of the sample was immersed into the 100 mL of deionized water, and was boiled at 80 ᵒC for 20 min before filtered through Whatman filter paper (41 pore size). After that, the cooled sample was stored for subsequent experimental usage.
Bioinspired production and characterization of ZnO NPs
For the bio-reduction process, 100 mL of E. platyloba extract was pipetted out and added to 100 mL of zinc nitrate (0.1 M) while stirring continuously at 80 °C using a hot plate magnetic stirrer until a blackish-green, viscous gel was generated. After that, we put the production in an oven at 90 °C to generate black precipitate. The precipitate obtained was calcinated at 700 °C for 2 hours to receive a white powder. The obtained NPs were characterized with SEM-EDX, zeta potential, DLS, TEM, ultraviolet-visible, and FT-IR analysis.
HSA interaction of green synthesized ZnO NPs UV–Vis spectroscopy
The [ZnO NPs + HSA] − [ZnO NPs] were noted from 2.0 to 400 nm. A constant concentration of HSA (1.66 × 10⁻⁵ M) was titrated against enhancing the concentration of ZnO NPs (2.04 × 10⁻⁵ to 2.00×10⁻⁴ g/mL), and baseline correction was done using the phosphate buffer solution.

Figure 1. (A) Digital Photograph of ZnO NPs were dispersed in water and (B) Filtering of the extract
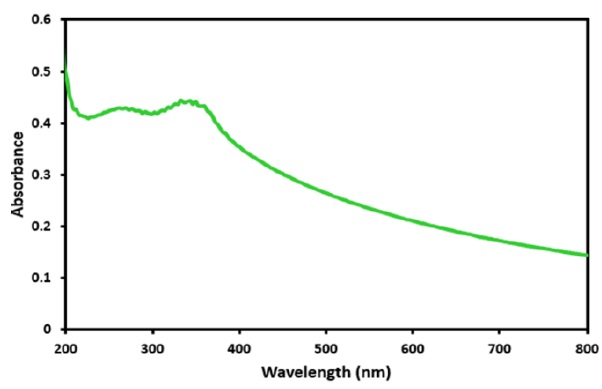
Figure 2. UV-Vis spectrum of ZnO NPs
Fluorescence studies
The HSA' fluorescence emission was noted both in the presence and absence of ZnO NPs at 288.15, 298.15, and 310.15 K from 3.0 to 520 nm. The fluorescence quenching spectra were excited at 295 nm. For the purpose of acquiring applicable data, it is necessary to correct the values of fluorescence intensity so as to eliminate the inner filter effect.
![]()
Where, Aex and Aem are the excitation, and emission wavelengths' absorbance values, Fcor and Fobs are reformed and observed fluorescence intensity, respectively [31].
Molecular docking study
AutoDok Vina (version 1.5.7) with MGL tools 1.5.4 was utilized to conduct the docking simulation. The protein' three-dimensional structure with PDB ID: 1BM0 was obtained from the protein data bank. Both the ZnO NPs and HSA were prepared for employing in Autodock tool. The optimized structure of HSA and ZnO NPs was converted into the required pdbqt format. The protein was enclosed in a box with number of grid points in x×y×z directions 78×48×82 and grid set centers of 28.51, 35.91, and 22.06 Å with a grid spacing of 1.00 Å. Gauss View 5.0 and Avogadro was employed to draw the ZnO NPs structure.
Results and Discussion
Electronic absorption titration
The metallic nanoparticles represent characteristic signals in specific wavelength regions in UV–Visible spectroscopy as a result of Surface Plasmon Resonance (SPR) phenomena [32]. The UV-Visible spectra were noted for the dispersed solution confected by ZnO NPs in water. The green synthesized ZnO nanoparticles show a clear and strong absorption edge observed below 400 nm (Figure 2). This indicates the zinc oxide nanoparticles' intrinsic band gap absorption due to the electron transitions from the valence band to the conduction band (O2p-Zn3d) [33].
DLS and zeta potential measurements of ZnO NPs
The DLS results showed that hydrodynamic size of the green synthesized ZnO NPs is in the range of 106.6 nm (Figure 3a). As the DLS measures the hydrodynamic radius of NPs, the obtained size from this analysis is larger than the obtained size from SEM and TEM. The particle morphology and suspension stability are affected by the zeta potential [34]. The corresponding average zeta potential value is -28.9 mV (Figure 3b), which supports the high dispersity, good colloidal nature, and stability of ZnO NPs as a result of negative-negative repulsion [35].
SEM and EDX analysis
The surface morphology of green synthesized ZnO NPs was explored by SEM analysis. As it can be seen, our ZnO NPs had a quasi-spherical shape (Figure 4a), and well-distributed nanoparticles with aggregation due to electrostatic attraction between ZnO NPs and the high surface energy of ZnO NPs or its polarity [36].
ZnO NPs' EDX spectrum is illustrated in Figure 4b, which authenticates the presence of Zn, O, C, Cl, and N elements with atomic percent of 16.62%, 41.99%, 23.90, 5.25%, and 12.24% respectively. The existence of Zn and O is related to the ZnO NPs synthesis while the existence of other elements such as C, Cl, and N is assigned to the E. platyloba extract.
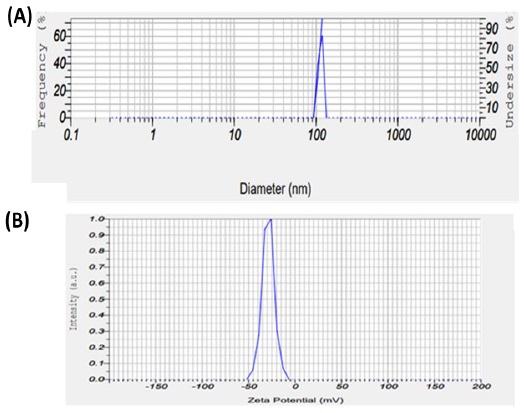
Figure 3. (A) DLS particle size analysis of ZnO NPs and (B) Zeta potential distribution of green synthesized ZnO NPs
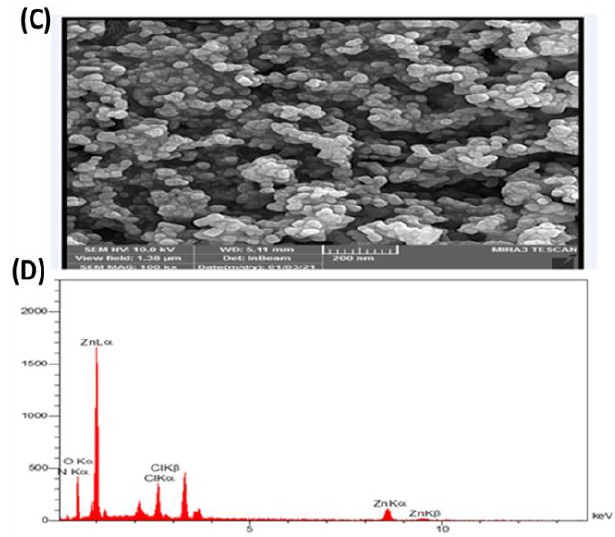
Figure 4. (A) SEM image of green synthesized ZnO NPs with different magnification and (B) EDX image of green synthesized ZnO NPs
TEM images
The size of particle and detailed study of morphology were explored using TEM analysis. As it can be seen in Figure 5, the green synthesized ZnO NPs are quasi-spherical in shape, some of them show facets and irregular shapes with different sizes from 27.18 to 54.24 nm [37].
Functional group analysis of ZnO NPs
Figure 6 represents the FT-IR profile of the E. platyloba extract and green synthesized ZnO NPs. The E. platyloba extract' spectrum has absorption bands at the wavelengths of 479, 619, 1112, 1384, 1618, 1638, 2034, 2926, and 3415 cm-1. The band at 619 cm-1 may represent the bending vibration of alkene –C=H. The band at 1112 cm-1 may indicate the –C-O stretching of polysaccharides or phenolic acid of the extract. The band at 1242 cm-1 was owing to the presence of C-N amine group. The band that appears at 1384 cm-1 is assigned to the C-H bending. The band was found at 1638 cm-1 belongs to the stretching vibration of C=C (deformation in the aromatic ring of flavonoids). The alkynes and carbonyl groups like C=O were responsible for the peak at 2034 cm-1. The band at 2926 cm-1 can be correlated to the stretching vibration of alkane groups (CH2- and CH3- groups) in the extract. The wavenumber at 3415 cm-1 might be due to the amide group and aromatic rings of flavonoids, polyphenols, and triterpenoids. The signals appear from 3000 to 2800 cm-1 might be due to the CH- stretching vibration of lipids [38, 39]. The alteration in the position bands of synthesized ZnO NPs at 3431, 1463, 1113, 1058, 873, and 525 cm-1 indicating involvement of the extract' phytochemicals in the ZnO NPs synthesis.
The interaction of ZnO NPs with HSA
UV-vis absorption spectroscopy
To gain preliminary insight into their extent of binding the interaction of the green synthesized ZnO NPs with HSA, a model plasma protein, was assessed employing the UV-Visible spectroscopic technique.
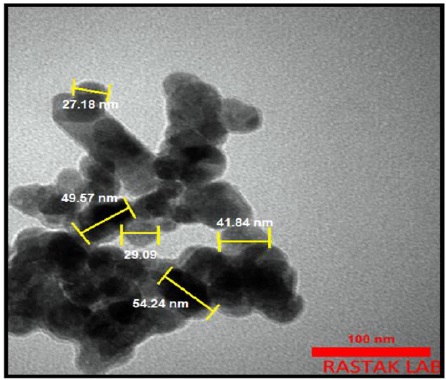
Figure 5. TEM images of green synthesized ZnO NPs
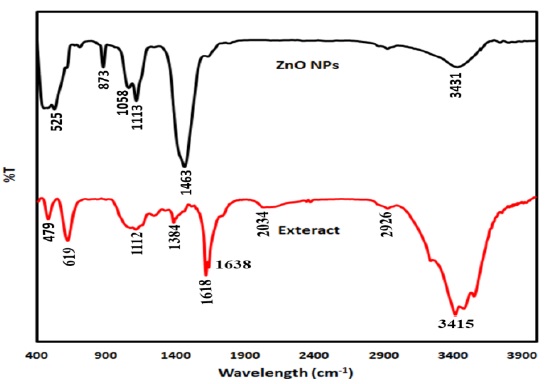
Figure 6. FTIR spectra of ZnO NPs produced by extract of E. platyloba
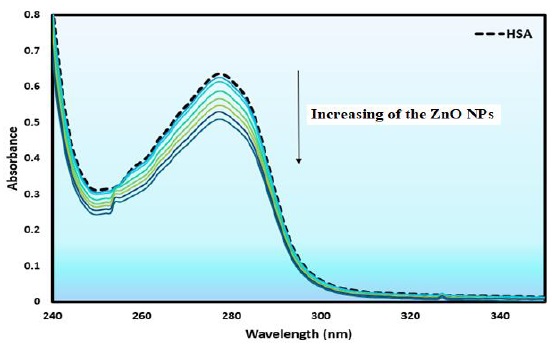
Figure 7. Absorbance spectra of HSA (1.66×10⁻⁵ M) with ZnO NPs (2.04 × 10⁻⁵ to 2.00×10⁻⁴ g/ mL)
HSA gives a characteristic absorption peak at 277 nm, which assigned to the π–π* transition of Trp, Tyr, and Phe amino acids residues [40]. The ultraviolet-visible absorption spectra of the HSA with and without ZnO NPs were examined. Figure 7 demonstrated that the absorption spectra of HSA exhibited hypochromism without any spectral shift, which originated from the ground state complex formation with ZnO NPs and effective interaction [39].
Fluorescence spectra measurements
Figure 8 depicts the HSA' fluorescence quenching spectra with and without ZnO NPs. The fluorescence emissions of the HSA' characteristic broad band at 348 nm were quenched with elevating concentrations of the ZnO NPs, which can be correlated to the binding of the ZnO NPs to HSA.
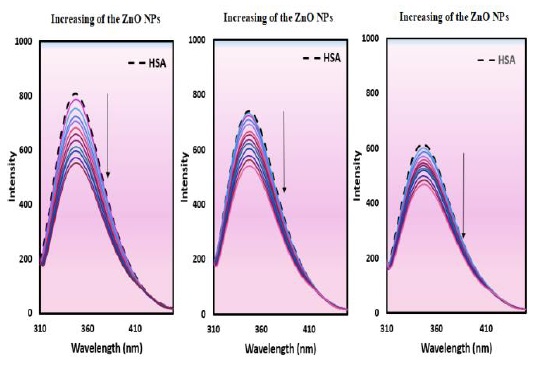
Figure 8. The fluorescence signals of HSA (5.00×10⁻⁵ M) with ZnO NPs (1.18 × 10⁻⁵ to 1.92×10⁻⁴ g/mL)
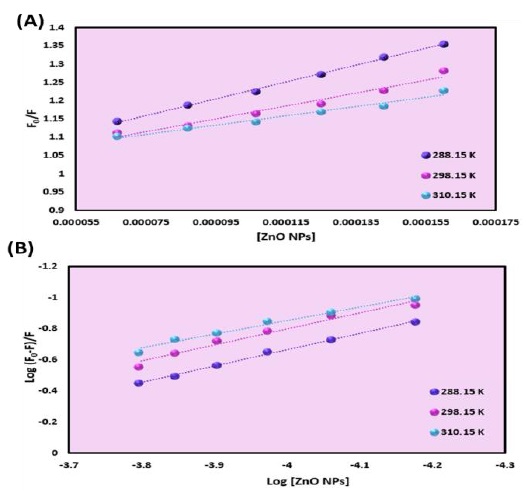
Figure 9. (A) Plot of F0/F versus [ZnO NPs] for HAS-ZnO NPs system and (B) Plot of log (F0-F)/F versus log [ZnO NPs] for HSA-ZnO NPs system
To clarify the quenching mechanism of the ZnO NPs by HSA and calculate the quenching constant, Equation (2) was employed [41]:
![]()
In this equation, F and F0 are the emission intensity of HSA with and without the ZnO NPs, τo is the HSA' lifetime in the absence of ZnO NPs, [Q] is the ZnO NPs ' concentration, Kq and, Ksv are the bimolecular quenching constant and Stern-Volmer quenching constant received from this equation Ksv = Kq τo. The quenching constant was received from the slope of the plot of F0/F vs. [ZnO NPs] (Figure 9a). The Ksv values decreased on rising the temperature, which suggested that the quenching process was a static quenching [41].
To obtain the binding sites' number (n) and the binding constant (Kb) the data of fluorescence could be fitted employing a double logarithmic regression curve [42]:
![]()
The Kb and n values could be received from the intercept and slope of linear regression of log (F0 - F)/F versus log [Q] (Figure 9b). The n and binding constant' values are listed in Table 1. Since the n value is almost equal to 1, it reveals that there is a binding site for the ZnO NPs on the HSA. The Kb' values decrease on elevating the temperature implies that the ZnO NPs-HSA complex decrease its stability on enhancing temperature [43].
Thermodynamic parameters and interaction forces
To obtain the binding interactions ' type between ZnO NPs and HSA the thermodynamic factors were determined. The Van’t Hoff equation (Equation (4)) was utilized to determine the ΔH0 and ΔS0 by employing the Kb' values at three temperatures [44].

The Van’t Hoff equation' slope and intercept was utilized to compute the binding enthalpy and binding entropy of ZnO NPs-HSA system. The following relationship was utilized to determine the free energy change (ΔG0):
![]()
The sign of ΔG0 is negative, which indicated that the ZnO NPs and HSA' interaction process was spontaneous [39]. The enthalpy and entropy' negative values (Table 1) suggest that hydrogen bond and Van der Waals forces are taken part in the HSA-ZnO NPs complex formation [31].
Table 1. Binding affinity and thermodynamic factors for the interaction of the ZnO NPs to HAS
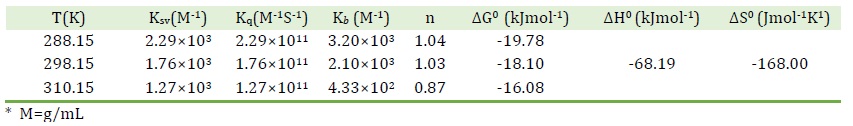
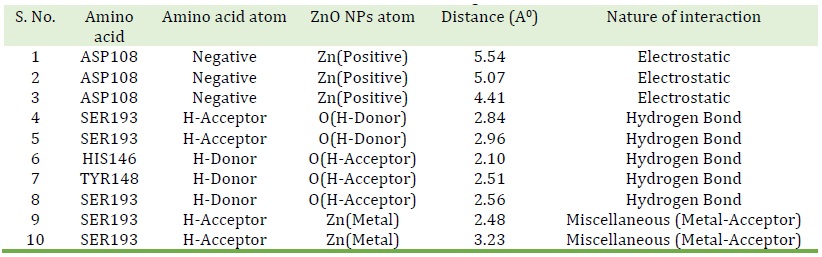
Table 2. Predicted bonds between interacting atoms of ZnO NPs and HAS
Docking study
Molecular docking simulations were performed to get detailed information about the interaction of ZnO NPs-HAS. Moreover, it is helpful in the validation of in vitro experimental results [45].
The bond lengths, atoms involved in bonding with ZnO NPs and nature of interactions are tabulated in Table 2. The amino acid residues of HSA that interacted with ZnO NPs are depicted in Figure 10. The ZnO NPs-HSA forms hydrogen bonds with three amino acids, which are SER193, HIS146, and Tyr148. In addition, there are three electrostatic interactions between ASP108 and the ZnO NPs. It is revealed the fluorescence experiments binding constant (3.20×10³ M-1) is in line with the docking simulation free binding energy (3.30 × 10³ M-1). The binding free energy change of binding, (∆G0 binding) was obtained by the following equation:
∆G0 binding = ˗ RTLnK binding (6)
It can be observed that the simulation of ZnO NPs-HSA interaction valid our in vitro experimental results [46].
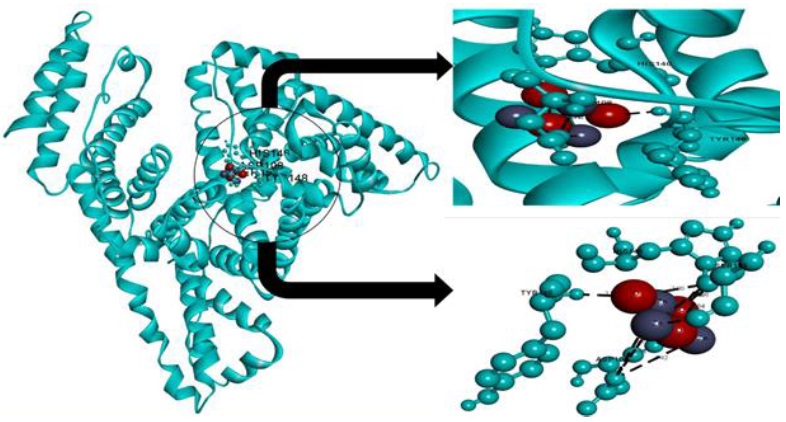
Figure 10. Molecular docking of ZnO NPs with HSA
Conclusion
The bioinspired synthesis process employing the E. platyloba extract facilitated the production of ZnO NPs. The characterization of ZnO NPs was done using various means. The experimental results of fluorescence showed that the HSA quenching by ZnO NPs is static. The thermodynamic parameters (∆H0 < 0 and ∆S0 < 0) are computed through Van’t Hoff equation, which revealed that hydrogen bond and Waals forces played leading roles in the interaction process. The obtained result from docking simulation coherence with the spectroscopic findings in authenticating the binding interaction between ZnO NPs and HSA.
Acknowledgments
Financial support from Payame Noor University Tehran Research Center is gratefully acknowledged.
Disclosure Statement
No potential conflict of interest was reported by the authors.
Funding
This research did not receive any specific grant from funding agencies in the public, commercial, or not-for-profit sectors.
Authors' Contributions
All authors contributed to data analysis, drafting, and revising of the article and agreed to be responsible for all the aspects of this work.
Orcid
Fatemeh Karampour
https://orcid.org/0000-0001-8719-8985
How to cite this manuscript: Fatemeh Karampour*. Green Synthesis and Characterization of ZnO Nanoparticles from Echinophora Platyloba DC. Extract and HSA Interaction Study. Asian Journal of Green Chemistry, 7(3) 2023, 149-162. DOI: 10.22034/ajgc.2023.394268.1384
)