Document Type : Original Research Article
Authors
1 Department of Chemistry, Payame Noor University, P.O. BOX 3149968143, Karaj, Iran
2 Research Center Karaj Moallem, Karaj, Iran
Abstract
The proposed idea in this article is initially to select the best seed layer in terms of spectral properties, and then to place the next nanostructured layers of ZnO on it. If the UV-Visible spectrum of the seed layer is suitable and desirable, the ZnO nanorod layer formed on it will have a better spectral quality. The result of this article shows that the formation of ZnO layer by layer and the selection of the best layer which is obtained by the change in the precursors’ concentration lead to a ZnO thin layer with high absorption range from in infrared to ultraviolet range. In this way, ZnO nanostructures are selected step by step based on UV-Visible spectroscopic properties which were based on the difference in the concentration of precursors and absorption value, and threshold. The study of FESEM image of ZnO thin layer indicates the formation of diagonal nanorods, which have a coral-like appearance with high ratio of length to diameter. XRD studies confirm the growth of diagonal nanorods when concentration of precursors increases. These properties have a good match with high and wide absorption in coral-like ZnO nanostructures.
Graphical Abstract
)
Keywords
Main Subjects
Introduction
The need for clean and green energy and concerns the reduction of fossil energy reserves have caused the general desire to use new energies such as solar energy, wind energy, and nuclear energy. Sunlight is one of the richest sources of energy, which includes a wide range of low to high-energy waves. Solar cells by trapping a part of this energy and converting into electrical energy have a special application in providing energy needed. In the new generation of solar cells, the use of semiconducting oxides such as SiO2, TiO2, and ZnO in nanostructured form has been expanded due to their ability to absorb high energy wavelengths [1-5].
In the meantime, ZnO nanostructures is the most distinctive and useful semiconductor with high chemical stability, high catalytic activity, low price, high adhesion, and ability of absorbing, and also neutralizing the ultraviolent wavelengths in sunlight. However, the study of ZnO UV-Vis spectroscopy shows that absorption starts from low energy region and reaches its maximum in the high energy region, which is actually threshold absorption. Using the ZnO capacity in the maximum absorption from low energy to high energy spectral regions can solve the problem of low absorption efficiency in dye solar cells [6, 7]. Ultraviolent-visible (UV-Vis) spectroscopy of bulk ZnO shows a weak absorption in all wavelengths from 800 to 200 nm and threshold absorption at around 374 nm. The UV-Vis spectroscopy of ZnO nanoparticles shows an increase in absorption in all wavelengths and blue shift of the threshold absorption, i.e. at around 368 nm [8-11]. The change in the threshold absorption towards the more energetic region and increase in absorption show the high capacity of ZnO nanoparticles in optical applications [5]. Investigations show that any slight change in the preparation of ZnO nanoparticles causes changes in shape, size, and physical properties such as band gap and threshold [4, 12]. Therefore, it is possible to absorb a wide range of spectrum and increase absorption efficiency using the combination of several ZnO nanostructures with each other [6] and even with other materials [13-15]. Despite the extensive research that has been done in this field, there is still a high capacity for research in ZnO nanostructures as catalytic activity [16, 17].
There are different physical, electrochemical, chemical, biological, and hybrid methods for ZnO nanostructure preparation, but chemical methods such as hydrothermal, chemical solution deposition (CSD) are more common and easier. In addition, it is possible to change more parameters, including precursors’ concentration, time, and temperature to achieve different size, shape, and physical properties [7]. The proposed idea in this article is initially to use the combination of two methods to prepare ZnO, i.e. the electrochemical method for the seed layer and the CSD method for growing the next layer on the seed layer. Second, the best seed layer should be selected in terms of spectral properties, and then the next nanostructured layers of ZnO should be grown on the selected seed layer. If the UV-Vis spectrum of the seed layer is suitable and desirable, the ZnO nanorod layer formed on it will have a better spectral quality [8, 16]. This type of preparation is a kind of innovation because in most methods only one method is used to prepare both the seed layer and the grown top layer [15-17]. Therefore, the basis of this research and its results are based on UV-Vis spectroscopy of ZnO nanostructures at each stage.
Experimental
Materials and Methods
Indium tin oxide (ITO) with resistivity of 22 Ω was purchased from Dyesol and cut to surface of 2 cm2. Materials of zinc nitrate Zn (NO3)2.6H2O, hexamethylenetetramine (C6H12N4) with commercial name of thiamine, ammonia solution (NH3OH), acetone, isopropyl alcohol, and ethanol, with analytical grade were used. The laboratory equipment used in making the ZnO nanostructure includes a BH-600A digital scale. Chronoamperometry (CA) technique was carried out in a conventional three-electrode cell powered by a potentiostat/galvanostat model 273 A. The equipment used for the analysis of ZnO nanoparticles, including UV-Vis spectroscopy, was performed with a Cintra 20 model spectrometer located in Payame Noor University. In addition, the microscopic images were taken using a field emission scanning electron microscope (FESEM) TeScan-Mira III model, located at Sharif Laboratory Technology Service Center.
Preparation of ZnO seed layer
The ITO was washed with acetone, isopropyl alcohol, ethanol alcohol, and water, respectively. The Zn (NO3)2 solutions were prepared with different concentration of 0.001, 0.01, and 0.1 M. Three samples of ITO/ZnO were prepared by electrodeposition of ZnO on the ITO via CA technique within three different concentrations of 0.001, 0.01, and 0.1 M of Zn (NO3)2 solutions at -0.85V/SCE during 100s and labeled sample-0.001, 0.01, and 0.1, respectively. At -0.85 V/SCE on the ITO surface nitrate ions (NO3-) reduce to OH- and immediately OH- ions along with Zn2+ ions, form ZnO deposition on the ITO (ITO/ZnO) [8]. This layer, which is known as a seed layer, was investigated by UV-Vis spectroscopy so that the best seed layer is selected for the highest absorption rate.
Preparation of ZnO nanorods
Solutions of thiamine were prepared with different concentrations of 0.001, 0.01, and 0.1 M. To prepare ZnO nanorods, three mixed solutions named solution-0.001, 0.01, and 0.1 were prepared, which correspond to the same concentrations of 0.001, 0.01, and 0.1 of both ZnO and thiamine solutions. Zinc nitrate was used as a source of ions and thiamine as a source of hydroxide ions. These mixed solutions have been used to prepare three different types of nanorod-layer on the best prepared sample of seed layer. In the next step, all three prepared sample-0.1 were used as a substrate for top layer of ZnO and placed in the mixed solution-0.001, 0.01 and 0.1 during 45 min at 25 C. Using thiamine as a hydroxide ion precursor and zinc nitrate as a zinc ion precursor, the nano ZnO is formed on the previous core layer [8]. Three prepared sample in this step is named sample-0.1-0.001, 0.1-0.01, and 0.1-0.1, respectively. These layers which are known as top layers were investigated by UV-Vis spectroscopy so that the best top layer is determined in terms of the maximum absorption.
Results and Discussion
UV-Vis spectroscopic studies showed that the absorption in all three seed layers, i.e. 0.001, 0.01, and 0.1 samples, has the same absorption pattern, as displayed in Figure 1. The absorption threshold of all three prepared samples is equal to 282 nm, which shows the reproducibility of CA technique in preparing the seed layer. The wavelength of the absorption threshold (282 nm), has a blue shift towards the more energetic region compared to what is found in the researches (368 nm) [2]. This amount of threshold absorption is consistent with very short deposition time and very low thickness of ZnO. The sharp absorption observed at 190 nm is related to the glass absorption in ITO [9].
The comparison of all three spectra shows that in the range of 282 to 150 nm, the shape and the amount of absorption of all three prepared samples are the same because in all three cases, the substrate is ITO layer. However, in the spectral region from 900 to 282 nm, high absorption is observed in the UV-Vis absorption of sample-0.1. Since the aim in this research is to achieve the maximum absorption in the entire spectral region, sample-0.1 was selected and three series prepared as a seed layer for continue working.
The study of the FESEM image related to sample-0.1, which has the highest UV-Vis absorption, showed that ZnO nanoparticles have grown horizontally and in a rod-like form, as depicted in Figure 2.

Figure 1. UV-Vis spectroscopy of three seed layers of ZnO with different precursor concentrations

Figure 2. FESEM of seed layer sample-0.1
As it can be seen in Figure 3, all three prepared samples (0.1-0.001, 0.1-0.01, and 0.1-0.1) have the same spectral pattern. The reproducibility of spectral pattern in all three prepared samples is a sign of the method correctness. Changing the precursors’ concentration from 0.001 to 0.01 M leads to the nanorods formation with more absorption. However, by further increasing the precursor concentration to 0.1 M, no noticeable increase in absorption (except around the absorption threshold) is observed. The absorption threshold is about 300 nm, which is larger than the absorption threshold of the seed layer prepared in this research (282 nm). Also, comparing this number with the absorption threshold value of 375-355 nm in other researches indicate the strong dependence of the absorption threshold on the preparation method [11].
As it can be observed in Figure 1, the sharp absorption observed at 190 nm is related to the absorption of the glass in ITO [9]. According to the scientific articles in the ultraviolet region, thiamine is also absorbed, but the characteristics of thiamine absorption are completely different from ZnO absorption. Based on Figure 3b, thiamine absorption occurs as two successive absorptions at 270 and 230 nm, and both absorptions increase with increasing thiamine concentration [18]. While in the UV-Vis spectroscopy related to ZnO, the absorption starts from infrared until ultraviolent wavelength with a peak at around 300 nm. The increase in the precursors’ concentration resulted in the absorption increase. This absorption pattern is quite specific to ZnO.
On the other hand, the absorption pattern observed in these spectra is quite similar to the absorption pattern in the Figure 1 which is related to the ZnO seed layers were prepared without the thiamine presence.
According to Figure 4a, FESEM of sample 0.1-0.1 of top layer shows nanorods with a hexagonal cross-section. Figure 4b shows the dimensions of a nanorod with 15.62 nm diameter and 1 µm length. As it can be seen, the diagonal growth of ZnO nanorods has led to the formation of a coral-like structure [8]. The reason for this oblique growth is the preferential tendency of some [hkl] planes to grow over other plates, which can be proven by studying the XRD spectrum.

Figure 3. (a) UV-Vis spectroscopy of three top layers prepared with different precursor concentrations and (b) thiamine absorption is derived from

Figure 4. FESEM of (a) nanorods in sample 0.1-0.1 as a top layer and (b) a nanorod dimension
Figure 5 demonstrates the XRD information of three prepared samples (0.1-0.001, 0.1-0.01, and 0.1-0.1) on the ITO. Correspondingly in sample 0.1-0.001, several [hkl] planes in ZnO are observed within the range from 2theta= 20° to 70°, especially two planes (100) at 27.34° and (101) at 38.66° are dominant on the ITO substrate. Likewise, other planes with weaker intensity exist such as (101), (102), (103), and (110) that are concerned ZnO wurtzite structure.
This kind of growth results in coral-like structures. It can be clearly seen that in sample of 0.1-0.01 and 0.1-0.1 preferential orientation in (100) and (102) planes increases because the growth along the nanorods length is related to the growth along the (100) and (102) planes. Therefore, XRD results are in good agreement with what exists in FESEM images in accordance to coral like growth, as illustrated in Figure 4a [18, 19].
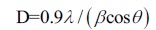
The crystallize size D (angstrom) of the individual peaks were analyzed by the Scherrer formula, (Equation 1), where λ is wavelength of XRD (1.541A), β is FWHM (full width at half maxima, in degree), and θ is the diffraction angle (in degree) [19].
Furthermore, the XRD results shows that the material is perfectly crystalline in nature and is composed of nano ZnO particles with an average diameter of 20 nm. Therefore it may be concluded that the present method of synthesis results in ‘perfectly’ Wurtzite ZnO semiconductor which ‘matches exactly’ to the relative intensities as well as with the peak positions to that of the standard JCPDS data file (file no. 05-0664) [19].
The preparation of this type of composite nanostructures of ZnO with a wide range of absorption can have various applications, including the utilization in solar cells, use as a sensor for the wavelength of incident light, and even as a catalyst for various reactions in the presence of light.

Figure 5. XRD of three prepared samples (0.1-0.001, 0.1-0.01, and 0.1-0.1) of ZnO
Conclusion
According to what was obtained from the UV-Vis spectroscopy studies, it is clear that the formation of ZnO layer by layer and the selection of the best layer obtained by the change in precursor’s concentration lead to the formation of a combination of a thin layer of ZnO with high absorption in infrared to ultraviolet wavelengths. The study of FESEM image indicates the formation of diagonal nanorods, which have a coral-like appearance with high ratio of length to diameter. These properties are consistent with high and wide absorption. In addition, XRD studies confirm the growth of diagonal plates with increasing precursor concentration.
Acknowledgements
The authors sincerely thank all those who provided them with the laboratory results as soon as possible. Also, they would like to present their gratitude to the Sharif Laboratory Service Center, the Payame Noor Univeristy of Tehran, and the Student Research of Moalem for providing the laboratory space.
Disclosure Statement
No potential conflict of interest was reported by the authors.
Funding
This research did not receive any specific grant from funding agencies in the public, commercial, or not-for-profit sectors.
Authors' Contributions
All authors contributed to data analysis, drafting, and revising of the paper and agreed to be responsible for all the aspects of this work.
Orcid
Ashraf Heidaripour
https://orcid.org/0000-0003-0223-5383
How to cite this manuscript: Ashraf Heidaripour*, Fateme Salmani, Tina Barati. Synthesis of coral-like ZnO nanostructures with high and wide absorption range. Asian Journal of Green Chemistry, 7(2) 2023, 140-148. DOI: 10.22034/ajgc.2023.393698.1382
)