Document Type : Original Research Article
Authors
1 Department of Chemistry, Payame Noor University, Tehran, Iran
2 Department Chemical Engineering, Payame Noor University, Tehran, Iran
3 Department of Polymer Science and Technology, Sri Jayachamarajendra College of Engineering, Mysore 570 006, India
Abstract
In present work, orange peel derived activated carbon (OPAC) loaded into poly (styrene-co-butyl acrylate) green composites were synthesized with different weight fractions of (OPAC) viz.,0, 2, 5, 8, and 10 wt% filler in the biocomposites. The effect of different water activity (aw) on the moisture sorption of Orange Peel Activated Carbon (OPAC) filled poly (styrene-co-butyl acrylate) green composites was investigated. Moisture sorption was carried out by exposing the composite specimens to different water activity (aw) from 0.1 to 0.9 at 25 °C. The obtained sorption data were used to fit five different sorption isotherm models; namely, Braunauer-Emmet-Teller (BET), Smith, Halsey, Caurie, and Oswin proposed in the literature. The model constants were determined by linear fitting of the sorption equations. The value of the coefficient of determination (R2 = 0.99) confirms the linear fitting of the equations studied.
Graphical Abstract
)
Keywords
- Styrene
- Butyl acrylate
- Sorption isotherm models
- Green composites
- Orange peel activated carbon (OPAC)
Main Subjects
Introduction
Sorption properties of any material are very important for design and optimization of many processes such as drying, packaging, and storage. Sportive uptake of composites by saturated solutions of different compounds having different activity at constant temperature yields sorption isotherms. One of the major challenges today is to maintain the mechanical and /or barrier properties during storage until disposal [1]. Water activity (aw) has become the basic controlling factor in the preservation of moisture-sensitive material for packaging applications against microbiological, chemical, and physical deterioration [2, 3]. With orange peel activated carbon (OPAC) being hydrophilic in nature, there is a need to address the sorption influence of orange peel activated carbon (OPAC)-incorporated composites to make it suitable for barrier application. Orange peel activated carbon (OPAC) was used for the present study, since the mechanical properties of films with orange peel activated carbon (OPAC) are better than the other types of orange peel activated carbon (OPAC) [4]. Equations for modeling the water sorption isotherms are of special interest in many aspects of packaging applications [5]. The sorption isotherms obtained from experimental data result in an estimation of the equilibrium moisture content, which is necessary to predict the hygroscopic properties of the composites. The equilibrium moisture content is an important quantitative measure in the practice of moisture sensitive products storage, packaging, and drying [6].
Many mathematical relations have been proposed in the literature to model hygroscopic equilibrium data in food packaging applications [7]. In the present work, effect of water activity was investigated on orange peel activated carbon (OPAC) filled poly (styrene-co-butyl acrylate) green composites, employing five sorption isotherm models proposed by Brunauer-Emmett-Teller [8], Smith [9], Halsey [10], Caurie [11], and Oswin [12]. Applicable ranges of water activity for the sorption isotherms of composites are reported.
Experimental
Materials and Methods
Styrene (St), butyl acrylate (BA) monomers, and potassium persulphate (PPS) as initiator were obtained from Aldrich chemical, USA. Orange peel was obtained from agriculture form north, Iran. All reagents were used without further purification.
Water activity (aw) standards
Saturated salt solutions of lithium chloride (LiCl2), potassium acetate (CH3COOK), magnesium chloride (MgCl2), potassium carbonate (K2CO3), sodium dichromate (Na2Cr2O7), sodium chloride (NaCl), potassium chromate (K2Cr2O3), and ammonium phosphate [(NH4)2 PO4] were used as aw standard of 0.11, 0.22, 0.33, 0.44, 0.54, 0.64, 0.75, 0.86, and 0.92, respectively. All chemicals were provided by Merck Company. The saturated solutions of these chemicals were put into different desiccators in which the samples were placed.
Synthesis of orange peel activated carbon (OPAC)
To prepare the orange peel activated carbon (OPAC), orange peel was initially collected, washed, and dried at room temperature, and then it put at 110 °C for 12 hours in a Hot Air Oven, after made powder by a mixer and sieved using a 30 mm mesh size (50 μm). It was carbonized at 450 °C during 2 hours under a nitrogen atmosphere. It was mixed with activating agent potassium hydroxide (KOH) (6 M) during 3 hours at room temperature, and dried at 120 °C for one day. The mixture was set a tubular furnace at 500 °C for 4 hours and was used as filler.
Composite synthesis
To synthesize poly (styrene-co-butyl acrylate)/(OPAC) green composites, styrene (St), and butyl acrylate (BA) a ratio of 70:30 dissolved in the methyl ethyl ketone including with different weight fractions of orange peel activated carbon (OPAC) viz.,0, 2, 5, and 10 wt.% and refluxed 1 h. The initiator is added into blend polymer and is heated at 70 °C for 30 min, and then the mixture poured a dish pleat to get biocomposite film.
Sorption experiments
Composite specimens of size (1 cm × 1 cm) were conditioned to 65% RH at 25+2 °C before exposing into different water activates (aw) at 25 °C. The initial moisture content (IMC) of the composite specimens of different composition was measured on a dry-weight basis by drying in a hot-air oven at 100 °C until constant weight was obtained. The approximate time taken for drying was 10 h. The sorption isotherm determination was performed by exposing the specimens to different aw ranging from 0.11 to 0.92 at 25+1 °C. The sorbet composite specimens were weighed until equilibrium (i.e. + 0.05% change in moisture content was attained (for a period of 30-40 days).
Sorption isotherm models
Five-sorption isotherm equations; namely, Braunauer-Emmet-Teller (BET), Smith, Halsey, Caurie, and Oswin were used to fit the experimental sorption isotherm data of orange peel activated carbon (OPAC) filled poly (styrene-co-butyl acrylate) green composite. The equations are arranged to facilitate the determination of appropriate coefficients using statistical modeling.
Braunauer-Emmet-Teller (BET) isotherm model
The sorption model that has received the greatest application to sorption studies on packaging applications is that of BET, the usual mathematical form of which is given as follows:
![]()
Where, Mm is the moisture content and C is the constant related to the net heat of sorption. It is well recognized that BET equation is an effective method for estimating the amount of water bound to specific polar sites in dehydrated systems used for food applications and water activity of standard saturated salt solutions are provided in Table 1.
The BET concept is a reasonable correct guide for two important aspects; namely, (i) the mobility of small molecules in several food systems becomes apparent at the BET monolayer and (ii) the BET monolayer correlates well with the total number of polar groups binding with water.
![]()
Table 1. Water activity of standard saturated salt solutions at 25 + 2 °C

From a linear plot of 1/[(1-aw) × M] verses [(1-aw)/aw], BET constants, Mm and C were computed.
Smith isotherm model
Smith suggested that sorption isotherms of biopolymers could be represented by the equation:
![]()
Where, Mb and Ma are constants. From a linear regression of M versus ln (1-aw), Smith constants were computed.
Halsey isotherm model
An expression for condensation of a multilayer at a relatively large distance from the surface was proposed by Halsey:

Where, Mb and Ma are constants. From a linear regression of M versus ln (1-aw), Smith constants were computed.
Halsey isotherm model
An expression for condensation of a multilayer at a relatively large distance from the surface was proposed by Halsey:
![]()
Where, a and b are Halsey constants, which can be estimated from a linear plot of ln (M) versus ln [-ln (aw)].
Caurie isotherm model
Caurie proposed the following equation for the estimation of water activity as;
![]()
Where, r and A are constants and M is the equilibrium moisture content. From the linear plot of ln (M) versus aw, the Caurie constants were computed.
Oswin isotherm model
This model is based on the mathematical series expansion for sigmoid-shaped curves and may be written as follows:
![]()
Where, a and n are constants. Equation (7) can be rearranged as follows:
![]()
Where, ‘a’ and ‘n’ are determined from the plot of ln (M) versus ln [aw/(1-aw)].
Results and Discussion
The relationship between aw and the moisture content (at constant temperature) is described practically by a moisture sorption isotherm. The effect of Orange Peel Activated Carbon (OPAC) content on the moisture-sorption characteristics of composites is displayed in Figure 1. All the moisture-sorption isotherm curves were typically of sigmoid shape. Baldevraj et al. [13] made a similar observation with respect to pure starch and LDPE/starch blends. Figure 1 indicates that sorption isotherms have three phases of sorption behavior namely, the monomolecular layer phase from 0 to 0.2 aw, the multimolecular layer phase from 0.2 to 0.7 aw and the capillary condensation phase above 0.7 aw. With increasing the orange peel activated carbon (OPAC) content as well as aw, the slope of the isotherms increased, solely due to the higher sorption of water molecules by orange peel activated carbon (OPAC) and or more sorption capacity of orange peel activated carbon (OPAC). The initial moisture content (IMC) values of poly (styrene-co-butyl acrylate) green composites with varying orange peel activated carbon (OPAC) content from 0 to 10 % and their corresponding water activities are listed in Table 2. It was observed that aw values increased with raising the orange peel activated carbon (OPAC) content to 8%. Beyond 8% of orange peel activated carbon (OPAC) in the composite, aw value was almost constant. This may be due to the optimized concentration of orange peel activated carbon (OPAC) content 8%. The equilibrium moisture content values for 0, 2, 5, 8, and 10% (w/w) orange peel activated carbon (OPAC) in composites at aw values of 0.1, 0.2, 0.3, 0.4, 0.5, 0.6, 0.7, 0.8, and 0.9 were taken from Figure 1.
Sorption model analysis
From the IMC-aw data, BET isotherm graphs were drawn and the results are presented in Table 2. The BET applicability over the entire region of 0.1-0.9 aw was studied. The range of applicability of the equation from 0.1 aw to the actual inflexion point is also reported in Table 2. The experimental sorption data applied to the BET model for the varying orange peel activated carbon (OPAC) content is illustrated in Figure 2 was found to fit for aw in the range 0.1-0.4. Timmermann [14], Jagiello and Olivier [15], and Baldevraj and Siddaramaiah [16] showed that BET equation holds only between water activities from 0.05 to 0.45, confirming the above finding. To evaluate BET constants, a linear fitting of Equation (2) was done.
Mm varied between 0.68 and 6.96 for composites with orange peel activated carbon (OPAC) content from 0 to 10%, respectively. This result indicates that, the composite with different amount of orange peel activated carbon (OPAC) content has varying capacities for water binding and availability of free water.
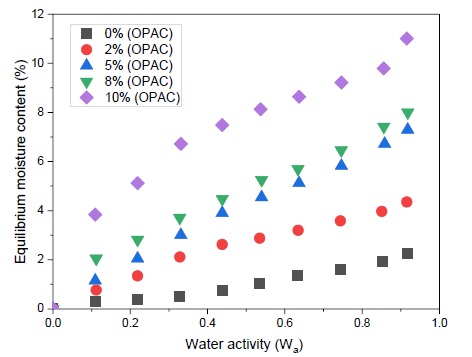
Figure 1. Moisture-sorption isotherm of orange peel activated carbon (OPAC) filled poly (styrene-co-butyl acrylate) green composites
Table 2. Variation of IMC with water activity (aw) for poly (styrene-co-butyl acrylate)/ (OPAC) green composites


Figure 2. BET sorption isotherm model for orange peel activated carbon (OPAC) filled green composites
The applicability of BET equation, in general, is restricted to water activities below 0.4 aw, which shows that adsorbent surfaces of the composites could be construed as practically homogeneous up to this maximum and that water fills the active sites in multilayer. This is consistent with the results computed by Igelesias and Chirife [17]. The monolayer moisture parameter of the BET equation is important for commercial shelf-life studies. Smith model represented by Equation (3) holds well for aw in the range of 0.3-0.9, as shown in Figure 3. This was in conformity with the result of Young, who reported that Smith equation fits well for aw in the range of 0.4-0.9. Smith constants were evaluated in a similar way as BET constants. Smith constants Mb and Ma ranged from 0.87 to 4.66 and 1.05 to 3.04 for composites with orange peel activated carbon (OPAC) content varying from 0 to 10%, respectively. From Figure 4, it is observed that the experimental sorption data of orange peel activated carbon (OPAC) filled composites applied to Halsey model [18], as given in Equation (4) fitted for aw which lies within the range of 0.4-0.9. The range of applicability for aw was within the limits for sorption behavior reported in the range of aw from 0.1 to 0.8 by Halsey. Halsey constants a and b varied from 0.38 to 1.84 and -0.56 to -0.47 for composites with varying orange peel activated carbon (OPAC) content from 0 to 10%, respectively.
Caurie model represented by Equation (5) was demonstrated in Figure 5a. According to this model, the experimental sorption results were in good agreement for aw in the range of 0.3-0.9. The hypothesis by Caurie that aw is valid from 0 to 0.85 (for most foods) merely supports the above range of determination for aw obtained by linear fitting. Caurie constants A and r ranged from 2.1 to 2.44 and -2.21 to -1.92 for different orange peel activated carbon (OPAC) filled composites, respectively. The Oswin model given by Equation (8) for the experimental sorption data of orange peel activated carbon (OPAC) filled poly (styrene-co-butyl acrylate) green composites fitted for aw, which is in the range of 0.5-0.9 (Figure 5b). Oswin constants a and n varied from 2.44 to 1.08 and 0.46 to 0.4 for composites containing varying amount of orange peel activated carbon (OPAC) ranging from 0 to 10%, respectively.

Figure 3. Smith sorption isotherm model for orange peel activated carbon (OPAC) loaded composites
The determination of model constants from Figures 3, 4 and 5 was done by linear fitting the sorption equation using Micorcal Origin 5.0 Professional software. The five-sorption models discussed above are used to evaluate the model constants for different ranges of aw to determine the composite durability and models applicability. The obtained values of the regression coefficient of determination (R2) for the different models are presented in Table 3. From this table, it is observed that aw values estimated by Smith, Halsey, Caurie, Bradley, and Oswin models are applicable in the range of 0.3-0.9. It can be inferred that, although the approach of the above models are different, it can still be used for the above range of aw. However, a very short range of 0.1-0.4 aw was observed for the BET relation, since the BET constants are applicable only for monomolecular layer systems.

Figure 4. Halsey sorption isotherm model for orange peel activated carbon (OPAC) loaded composites


Figure 5. The plots sorption isotherm model of (a) Caurie and (b) Oswin for orange peel activated carbon (OPAC) filled green composites
Table 3. Sorption isotherm model constants and coefficient of determination (R2) from linear-fitting of equations for orange peel activated carbon (OPAC) filled composites

Conclusion
Moisture-sorption isotherms of orange peel activated Carbon (OPAC) filled poly (styrene-co-butyl acrylate) green composites are essential to determine the sorption influence of orange peel activated carbon (OPAC) in the composites due to the hydrophilic nature of orange peel activated carbon (OPAC). Water activity (aw) is the most important factor affecting the durability (shelf life) of packaging material. The relative sorptive capacity of the unfilled composite is less due to the presence of hydrophobic groups. The constants (slope) of different sorption model equations are significant in the evaluation of shelf life stability of orange peel activated carbon (OPAC) filled composites. With the growing awareness on the use of orange peel activated carbon (OPAC) filled composites in various applications, the present study on the applicability of water activity will give insight into the prediction of composites durability for packaging applications.
Disclosure Statement
No potential conflict of interest was reported by the authors.
Funding
This research did not receive any specific grant from funding agencies in the public, commercial, or not-for-profit sectors.
Authors' Contributions
All authors contributed to data analysis, drafting, and revising of the article and agreed to be responsible for all the aspects of this work.
Orcid
Shahryar Pashaei
https://orcid.org/0000-0003-0356-4672
Soleyman Hosseinzadeh
https://orcid.org/0000-0001-7013-490X
How to cite this manuscript: Shahryar Pashaei*, Soleyman Hosseinzadeh, Siddaramaiah. Moisture Sorption Behaviour of Orange Peel Activated Carbon (OPAC) Filled Poly (Styrene-Co-Butyl Acrylate) Green Composites. Asian Journal of Green Chemistry, 7(2) 2023, 110-120. DOI: 10.22034/ajgc.2023.386513.1373
)